Troubleshoot & FAQ
No metrics data could be found
Shall the application not be able to find any Kafka metrics in Splunk in respect with your configuration, the Overview landing page will show the following modal message:
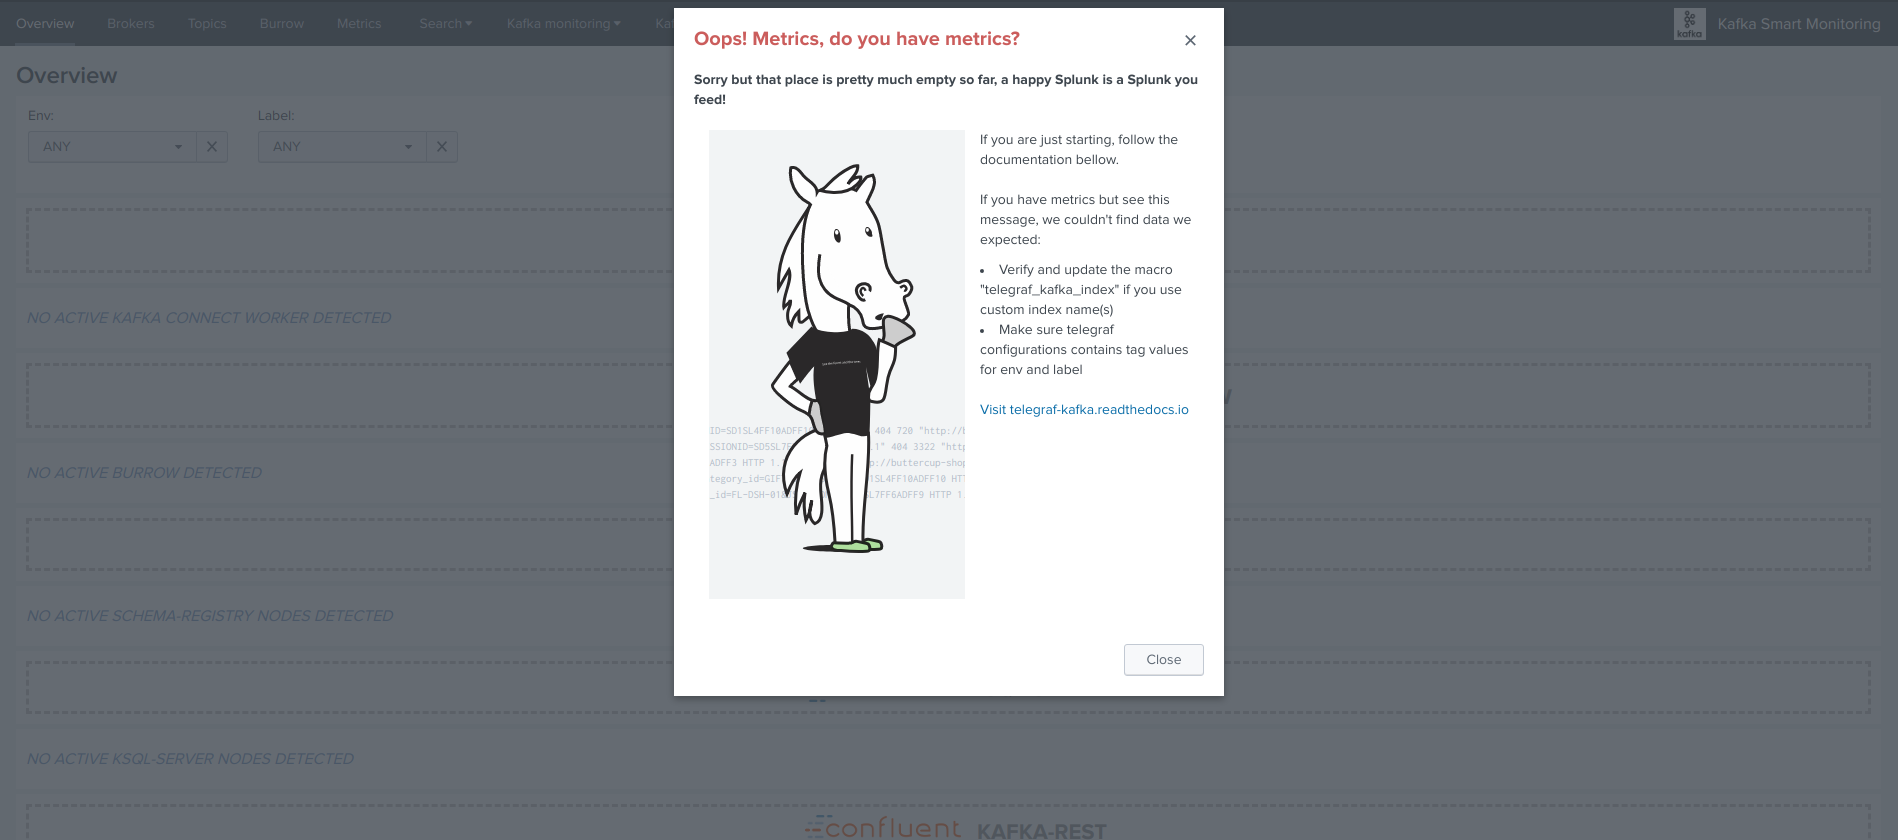
Root causes can be:
- No metrics could be collected by Telegraf
- Telegraf cannot send the metrics to your Splunk HEC endpoint
- The index name differs from the default “telegraf_kafka” index and the macro “telegraf_kafka_index” was not customised
- Telegraf configuration does not provide a value for env and label tags
Unsupported configuration detected in tags
The value for env and label tags must not contain any white spaces or tabs to avoid token exchange issues in the dashboard navigation.
Shall this be the case, a modal error window will open automatically when opening the Overview page:
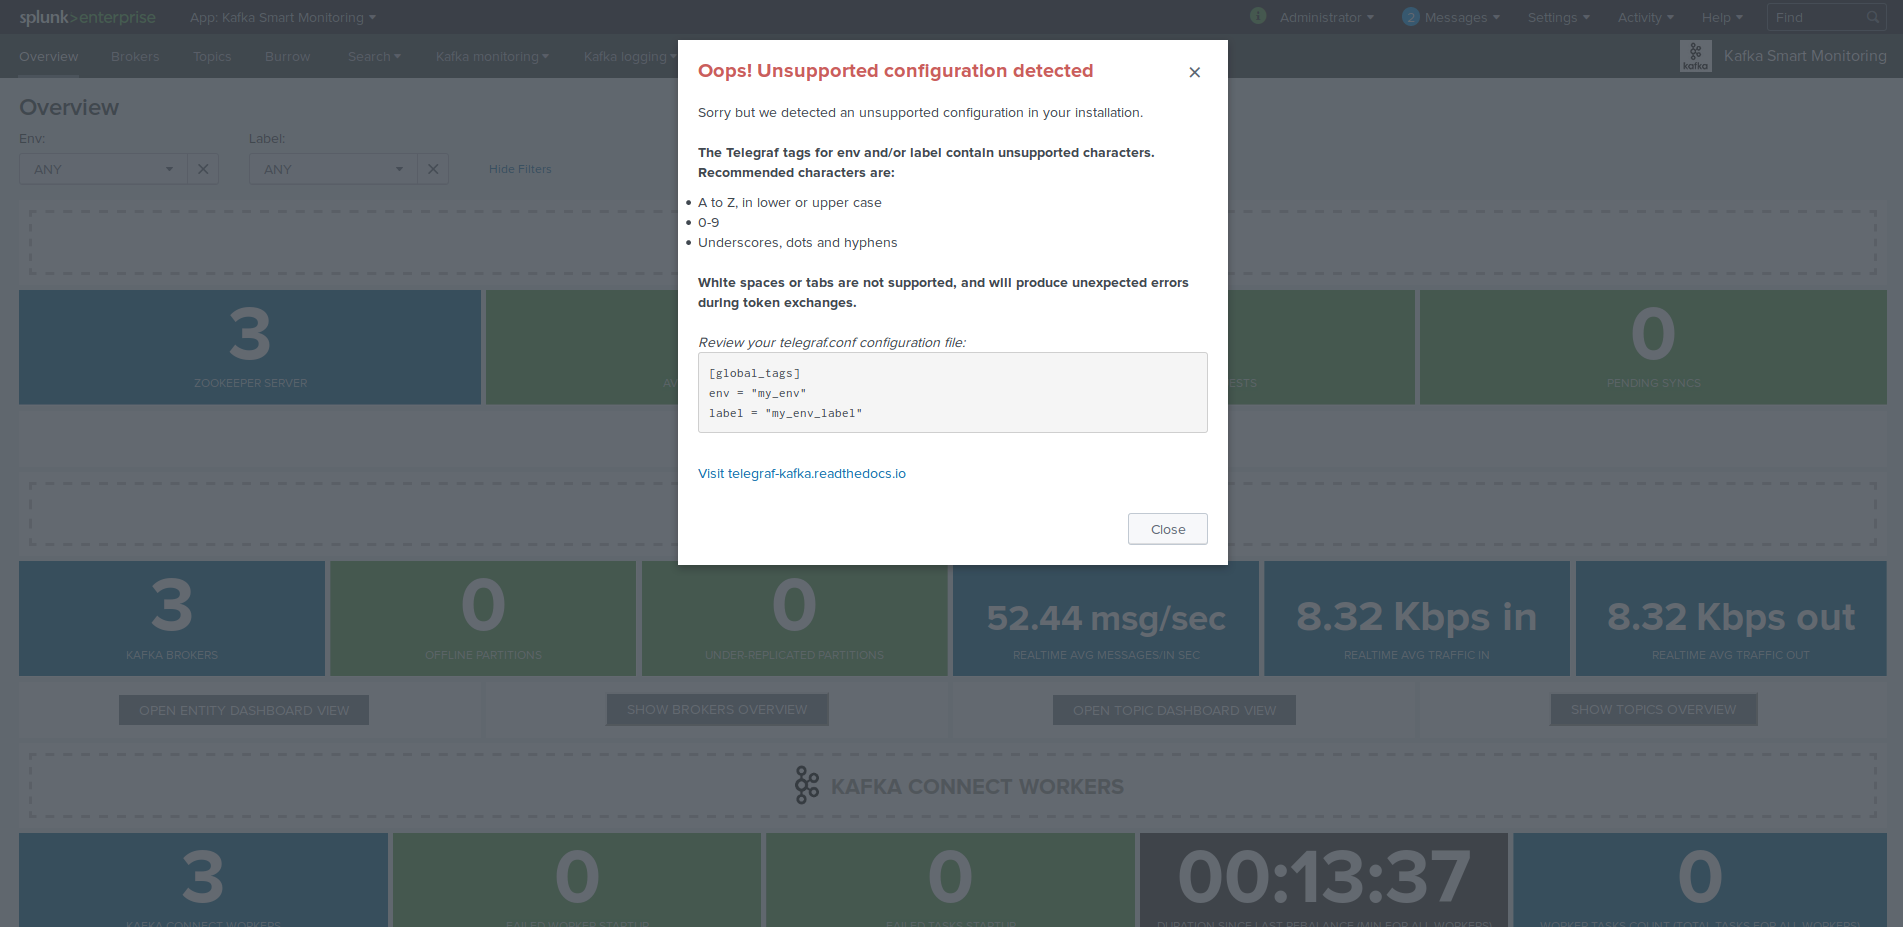
If this happens, then your Telegraf tags are incorrect, fix your telegraf.conf configuration files, example:
[global_tags]
  # the env tag is used by the application for multi-environments management
  env = "docker_env"
  # the label tag is an optional tag used by the application that you can use as additional label for the services or infrastructure
  label = "testing_env"
Once the fix has been applied properly, the error message will disappear.